What Is Sequence of Returns Risk?
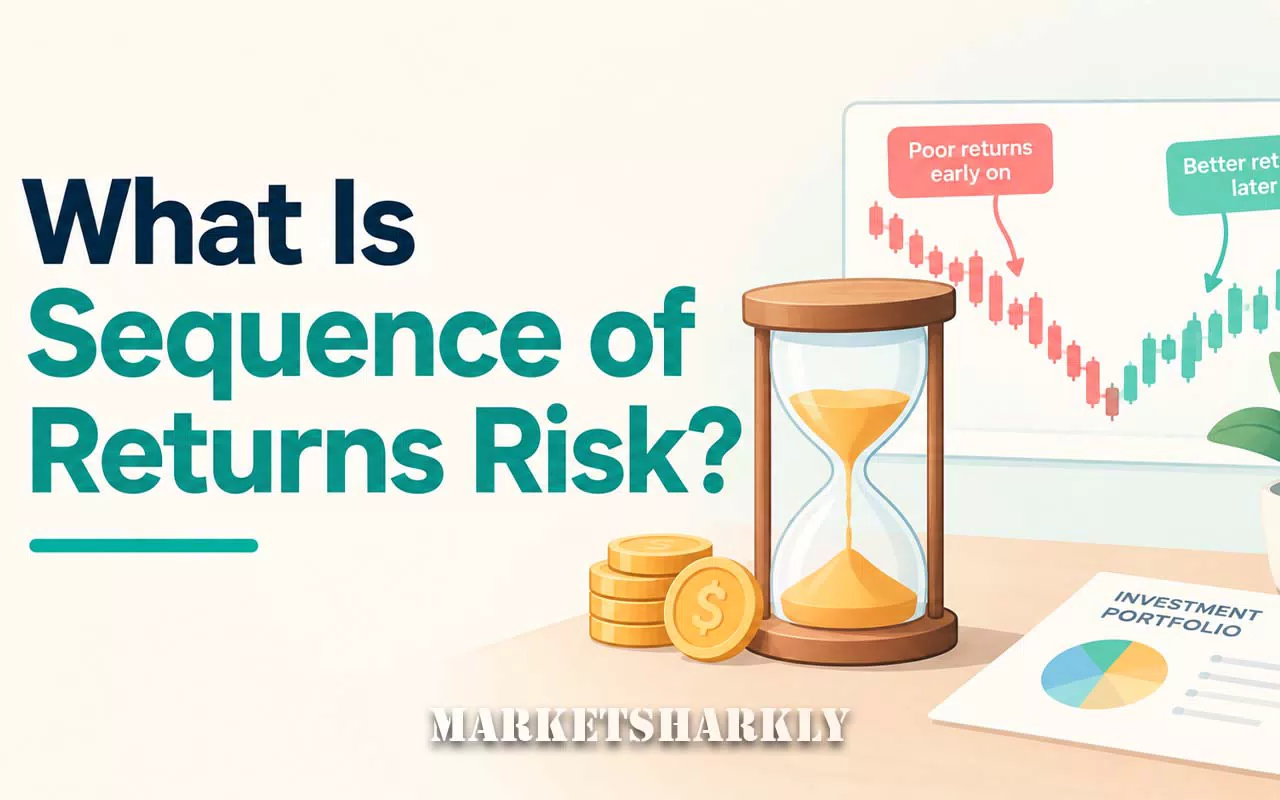
Two retirees can experience the exact same average annual return over a 20-year retirement — down to a tenth of a percent — and one ends up with over a million dollars while the other runs out completely. The only difference is the order the returns arrived in. That's sequence of returns risk, and it's arguably the single most counterintuitive concept in retirement planning, because it violates the assumption most people carry from the accumulation years: that average return is what matters.
Why Order Matters Once You're Withdrawing
While you're saving and adding money to a portfolio, the order of good and bad years genuinely doesn't matter much — a bad year early just means your later contributions buy in at lower prices, and the math roughly works out the same regardless of when the good and bad years land.
The moment you start withdrawing a fixed amount each year, that symmetry breaks. A market decline early in retirement forces you to sell a larger proportion of a smaller portfolio to generate the same dollar withdrawal, permanently reducing the base that has to recover — and generate all future withdrawals — for the rest of retirement. The identical decline arriving late in retirement does far less damage, because by then either the portfolio has grown a cushion, or there are simply fewer future withdrawals left to fund.
A Rigorous Example: Identical Average Return, Opposite Outcomes
To isolate this effect precisely, take the same 20 annual returns, used in two different orders — so the average return is mathematically identical in both cases (5.7%/year) — applied to two identical $1,000,000 portfolios, each withdrawing $50,000 in year one (a 5% starting rate) with 3% annual inflation adjustments.
Scenario A: Bad returns arrive first. The sequence opens with −15%, −10%, +5%, −5%, then improves from there.
Scenario B: The exact same returns, reversed. The identical years now arrive in the opposite order — the strong years first, the weak years last.
What Happens to Scenario A (Bad Returns First)
Year | Withdrawal | Balance After Growth |
|---|---|---|
1 | $50,000 | $807,500 |
2 | $51,500 | $680,400 |
4 | $54,636 | $573,882 |
8 | $61,494 | $524,549 |
16 | $77,898 | $190,656 |
17 | $80,235 | $121,463 |
18 | $82,642 | $41,538 |
19 | $85,122 | Depleted |
This portfolio runs out of money in year 19 of a planned 20-year retirement — despite averaging a healthy 5.7% annual return over the full period.
What Happens to Scenario B (Same Returns, Reversed Order)
Year | Withdrawal | Balance After Growth |
|---|---|---|
1 | $50,000 | $1,026,000 |
2 | $51,500 | $1,062,205 |
4 | $54,636 | $1,127,681 |
8 | $61,494 | $1,272,225 |
20 | $85,122 | $1,008,699 |
This portfolio doesn't just survive — it ends the same 20 years larger than it started, comfortably above $1 million, while funding the identical inflation-adjusted withdrawals the entire time.
Same 20 numbers. Same average. Same withdrawal schedule. One portfolio dies with a year to spare; the other grows. The only variable that changed was which years the bad returns landed in.
Why This Happens: The Mechanics
The damage in Scenario A comes from a specific interaction: withdrawing a fixed dollar amount from a portfolio that has just shrunk means selling a disproportionately large share of what's left. After the −15% and −10% start, the portfolio has already dropped from $1,000,000 toward roughly $807,500 and then further — and the $51,500 second-year withdrawal now represents a meaningfully bigger bite out of a smaller pool than it would have against the original balance.
Every subsequent year compounds against that already-diminished base. There's simply less capital left to catch a ride on the good years that come later in the sequence — the exact opposite of Scenario B, where those same good years arrive while the balance is still large, building a cushion that absorbs the bad years once they finally show up.
Why This Matters More at the Start of Retirement Than Any Other Time
This risk isn't spread evenly across a 20- or 30-year retirement — it's overwhelmingly concentrated in the first several years after you stop working (and, to a lesser extent, the last few years before). Financial research commonly refers to this window as the retirement red zone: the portfolio is at its largest, and the retiree has the least time remaining to recover from a bad early sequence before drawdowns permanently damage the base.
This is precisely why the safe withdrawal rate research discussed elsewhere lands on a starting rate well below the long-run average return of stocks and bonds — the safe rate isn't calibrated to the average outcome, it's calibrated to survive the worst plausible sequence, which is exactly what sequence risk describes.
What Actually Reduces Sequence Risk
Spending flexibility. The single most effective lever. A retiree willing to reduce withdrawals after a bad year, or skip an inflation adjustment, breaks the exact mechanism that caused Scenario A to fail — withdrawing less from a shrunken portfolio leaves more of it intact to benefit when returns eventually recover.
A cash or bond buffer for early retirement. Holding one to a few years of spending in cash or short-term bonds means a market downturn in year one or two doesn't force selling depressed stock holdings at the worst possible moment — the buffer funds spending while equities are given time to recover.
Reducing equity exposure specifically around the retirement transition. Since the red zone is where sequence risk concentrates, some strategies deliberately reduce stock allocation in the years immediately before and after retirement, then increase it again once the highest-risk window has passed — sometimes called a bond tent or a glide path.
Guardrails strategies. Formal rules that pre-commit to spending cuts after bad years and increases after good ones (rather than deciding emotionally in the moment) directly target the mechanism shown in the example above — a fixed, un-adjusting withdrawal is precisely what turned a bad first four years into total depletion by year 19.
Delaying claiming other guaranteed income, such as Social Security, can also reduce reliance on the portfolio during exactly the years when sequence risk does the most damage — though that trade-off depends on the broader claiming-age analysis covered elsewhere.
Why This Doesn't Show Up in Simple Average-Return Calculators
A basic retirement calculator that assumes a single constant annual return every year — say, "the portfolio grows 7% a year" — mathematically cannot produce sequence risk at all, because there's no variation in when good or bad years occur; every year is identical by construction. This is exactly why more sophisticated retirement research relies on either historical backtesting (using real, actually-ordered historical return sequences) or Monte Carlo simulation (generating many randomized orderings of plausible returns) rather than a single average-return projection — a calculator using a flat average return will systematically overstate how safe a withdrawal plan actually is.
Frequently Asked Questions
Does sequence of returns risk apply while I'm still working and saving?
Not in the same damaging way. While contributing regularly, a bad sequence early actually helps slightly (buying more shares at lower prices), and the order of returns matters far less to your final balance than it does once you're withdrawing rather than adding.
Can I predict which sequence I'll get?
No — this is precisely the risk, not a forecastable event. Nobody knows in advance whether their personal retirement will open with a strong market or a weak one, which is why the strategies to manage it (flexibility, buffers, reduced early equity exposure) focus on resilience across any sequence rather than betting on a specific outcome.
Is a higher average return enough to protect against this?
No, and the example above demonstrates exactly why — both scenarios had the identical 5.7% average return, yet one portfolio was fully depleted. Average return alone doesn't capture sequence risk; only the actual year-by-year order does.
Does sequence risk mean I should avoid stocks near retirement?
Not necessarily avoid — but many approaches do call for reducing equity concentration specifically around the retirement transition, since that's when a downturn does the most damage, then increasing it again once the highest-risk window has passed.
Is this the same thing as market volatility?
Related but distinct. Volatility describes how much returns swing; sequence risk describes how much the timing of those swings matters once withdrawals are involved. A volatile portfolio with good returns early poses less sequence risk than the identical volatility with bad returns early.
Key Takeaways
Sequence of returns risk is the danger that the order in which investment returns arrive — not just their average — determines whether a retirement portfolio survives, because withdrawals taken from a portfolio that has just declined permanently reduce the base available to recover. The worked example above shows this in its starkest form: two identical 5.7% average returns, reordered, producing complete depletion by year 19 in one case and portfolio growth to over $1 million in the other.
Because this risk concentrates heavily in the first several years of retirement — the "red zone" — the most effective defenses (spending flexibility, cash buffers, reduced early equity exposure, guardrail rules) are specifically aimed at surviving a bad sequence early, not at improving the long-run average return, which the example demonstrates isn't the variable that actually matters most.
Sources
Bengen, William P. "Determining Withdrawal Rates Using Historical Data." Journal of Financial Planning, October 1994.
Morningstar — Morningstar's Retirement-Income Research: Finding Your Safe Withdrawal Rate
This article is for general educational purposes only and does not constitute financial, investment, tax, or legal advice.